|
What is the value of a one hundred-dollar bill?
Some would be inclined to answer by describing money’s fungibility: five twenty-dollar bills, ten ten-dollar bills, one hundred one-dollar bills etc. Although correct, these answers are lacking context, and we are not left with any information that is particularly helpful in terms of money’s function as a medium of exchange or real value.
This is like saying a foot is 12 inches long, and although also correct, without the use of a ruler or measuring tape, describing a foot as 12 inches gets you no closer to information that describes its actual length.
A dollar bill, or any other fiat currency that is used as money, has basically two values at all times, the nominal value, like in the above answer, and the real value, which is a bit more elusive. Nominally, $100 was exactly the same in 1909 as it is in 2018, and will be in 2050. Only using it as a medium of exchange we discover its real value, also known as its “purchasing power.
While this may seem obvious, you will see that we all suffer from the illusion of nominal value.
The higher quantity of dollars that we earn, the more we invest them, the wealthier we may feel as compared to previous generations. But are you really any wealthier? Nominally, I am sure you are, but is your wealth real?
Through the constant fluctuations in currency exchange rates, and the ever-present monetary inflation, the dollar is continuously devalued and worth less and less every year. There are estimates that the dollar has lost 95%-98% of its purchasing power in a little over one century.
In other words, the current dollar has the same real value of about 2-5 pennies did in 1913.
So why do we all measure the perceived values of goods and services using dollars? Again, to measure the real value of something, you cannot use a metric which does not have a fixed value. This would be like a carpenter using a measuring tape that changed its length everyday to build your house. The lengths described on a measuring tape must stay fixed, that way you know what an inch, a foot, or 10 feet is every time you use it.
Our “measuring tape,” the dollar, changes in value constantly, therefore trying to use its nominal value is misleading and useless as a description of real value.
Think about it another way. Let’s say your grandfather earned $6,000 in 1955, and you’re going to earn $54,000 in 2018. At first blush you seem to be doing better off, having earned nine times his salary in the same 365-day period. Clearly you are earning more, but are you actually better off, or more wealthy, than he was?
The answer, sadly, is probably not. Just using the official government’s Bureau of Labor Statistics data, which some say is not truly representative of actual inflation, you would need to earn about $58,000 per year to have around the same purchasing power as your grandfather’s $6,000.
This is the nominal dollar illusion. It’s not really how many dollars you have, it’s what you can actually exchange them for.
So back to our original $100 bill example. Nominally, you and your grandfather have the same amount of money, the only difference is that his 1955 $100 bill was able to purchase what would cost you $930 today, and his father’s 1918 $100 bill was able to purchase what would cost you over $1,700 today.
So the question must be asked, what will that $100 bill in your wallet today be worth in 2054?
Using the the “rule of 72,” take 72 and divide it by the Federal Reserve’s target inflation rate of 2% (which is also probably grossly understated). You will get 36. This is roughly the time, in years, it will take to diminish the purchasing power of all the dollars you hold today by 50%. So, all things constant, in 2054 your $100 bill will purchase approximately what $50 does today.

Using The Correct Ruler
Reveals The Illusion
When attempting to measure value, instead of using the dollar as the “ruler,” why not substitute another form of money which has been used and has maintained its purchasing power for over 5,000 years, all over the world, as the measure?
When you start to measure things in terms of gold, which is a much more stable metric, you begin to truly uncover the nominal dollar illusion....
The home I am sitting in as I write this article was purchased brand new in 1950 for approximately $8,500, and again purchased in 2012 for $310,000. The original owner would have made over 36 times his original investment in a little over 60 years. Ask most anyone and they will point to this example as proof that real estate always goes up in value — but what if I told you this was wrong?
In 1950, an ounce of gold was valued at $40.25, and although it was not legal for private ownership, gold was still correlated to the dollar at a fixed rate. So in terms of gold ounces, the new home cost the original owner approximately 211 ounces of gold ($,8500/$40.25). Some 62 years later, in 2012, the home was sold for approximately 187 ounces of gold, as the price for an ounce of gold was approximately $1,655 ($310,000/$1,655).
So when measuring goods and services in terms of gold, you can see that this home cost 24 ounces less than it did six decades earlier, despite the fact that it cost over $300,000, or 3,600%, more in dollars.
This is the nominal dollar illusion.
Throughout history, the median single-family home has consistently cost approximately 200 ounces of gold, with fluctuations near this figure. The exception of course is a speculative bubble.
The same home I described above was also sold in 2005, during the height of the first American housing bubble, for $445,000. The gold price then was approximately $505 per ounce then, so the buyer paid around 880 ounces of gold, or four times the normal cost. While the housing bubble was evident to some observers even just using dollar terms, it was so obviously a bubble using the gold metric and history.
This begs the question, are the prices of goods, services and assets rising, or are we just measuring the dollar’s decline in purchasing power through monetary inflation and time?
A great resource, PricedInGold.com, catalogs amazing research and charts by Sir Charles Vollum that can help answer this question. This research prices all manner of things in gold grams, rather than dollars.
The “bull run” in equity markets have certainly been in the news a lot as of late. Just in the beginning of this year the Dow Jones Industrial Average and S&P 500 were reaching all-time highs on more dates than one could count. So, in terms of dollars, equity values have never been higher. What happens when these indices are priced in gold?
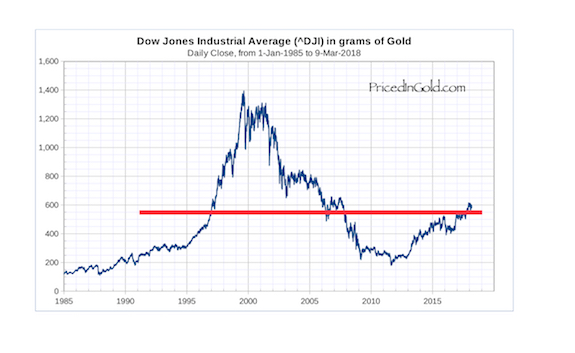
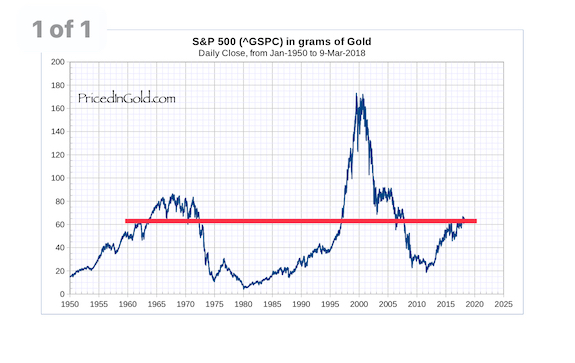
As you can see by the red horizontal lines in the above charts, the Dow Jones Industrial Average is the same value, in terms of gold, as it was in 1997. The same can be said for the S&P 500, although it actually reached its present-day value in 1962.
What about the housing and real estate markets? Most housing markets, with the exception of a few during the first housing bubble in 2005-2006, are again at new all-time high dollar values.
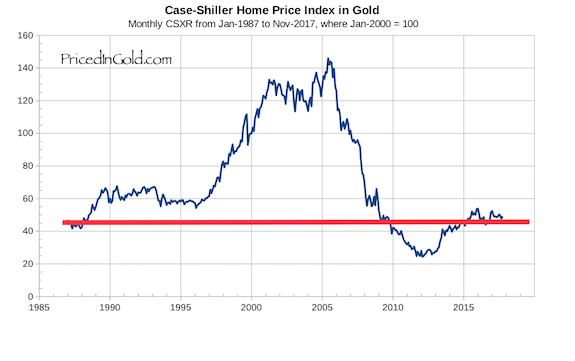
Despite record housing prices in dollars, in terms of gold, homes are now at 1987 values. In other words, there have only been constant upward prices in dollar terms; using gold, housing prices have fluctuated greatly.
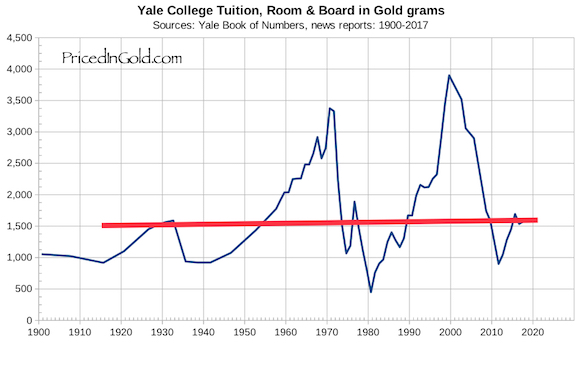
We have all heard of the constantly increasing costs of tuition, room, board and textbooks for colleges and universities. By most estimates, a college education has never been more expensive.
Or has it? Below is a chart depicting Yale College’s room, board and tuition over the last 118 years. When priced in gold, these expenses are the same today as they were in the 1930s.
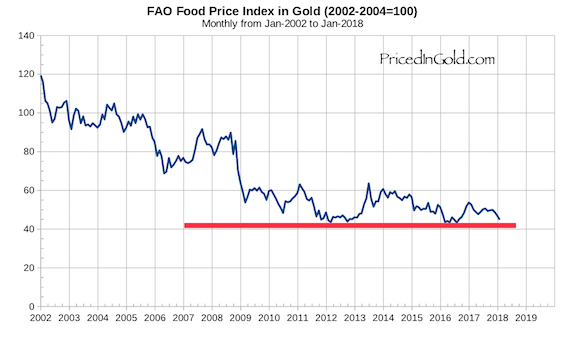
Another major expense for families is the ever-rising cost of food and groceries. Despite America being an agricultural powerhouse, it seems that over time food and groceries just keep getting more and more expensive. Contrary to the dollar expense, when you price the FAO Food Index in gold, you’ll discover that food has generally never been as inexpensive as it is today.
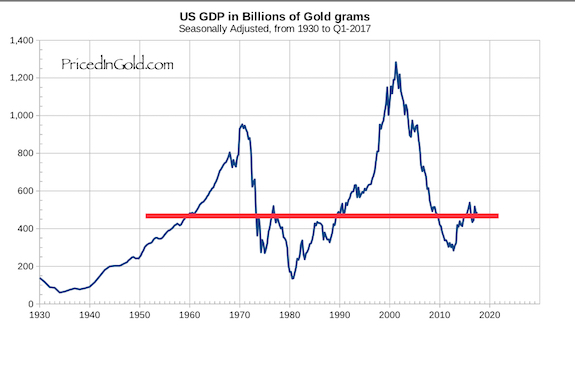
Americans are told that the country is nine years into an economic expansion, or “recovery,” and that there is strong growth. Some in the mainstream financial media conjecture that this can potentially become the longest economic expansion in United States history.
While our economy, in nominal terms, has reached the $18 trillion level, do we see the same growth when the Gross Domestic Product is priced in gold? No — what you see is that GDP is currently only at its 1960s levels, and fluctuating as opposed to reaching higher. It is not a steady rise the way it appears in dollar terms.
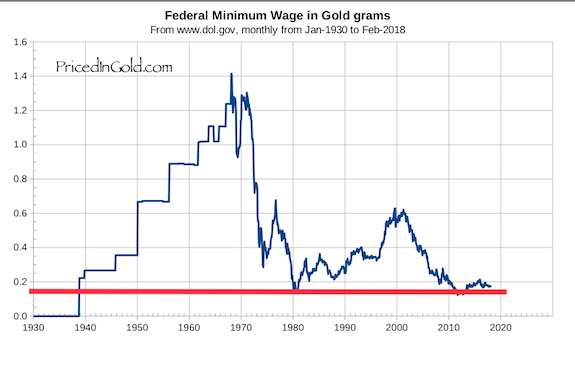
Despite all the press coverage, protests and political posturing over the Federal minimum wage, it seems far more convincing to use the below chart to understand wealth and income inequality in today’s era.
In terms of gold, the Federal minimum wage peaked long ago, in the 1960s, and is now hovering around the 1939 level. If gold was used as a metric, it would be abundantly clear that low-wage employees haven’t really seen a wage increase since the Federal minimum wage was enacted.
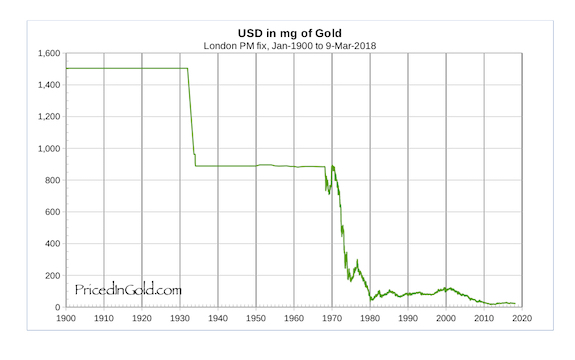
Last, but not least, is the cornerstone of my entire argument.
The chart below demonstrates exactly why nominal dollar values are so misleading. A dollar today and the dollar of 1900 are vastly different mediums of exchange. Although nominally they are exactly the same, the purchasing power, or real value, is not.
When you price the U.S. dollar in milligrams of gold, you see immediately that the dollar has dropped in value from 1,500 milligrams to well under 50. Pricing the dollar in gold, as opposed to gold in dollars, demonstrates the devaluation and declining purchasing power of the dollar versus a reliably stable metric.
It is clear that in an advanced economy like the United States, using a fluctuating, ever-changing, ever-devaluing fiat currency to value labor, goods, services and assets is simply a fool’s errand.
We all collectively suffer from valuing things in nominal dollar terms, so the next time you hear about a rally in stock markets, high home values or increasing costs of living, remember that through decades of monetary inflation and low interest rates, it is extremely difficult to accurately measure the fair value of anything without a stable, fixed metric.
Note: A 34-year-old private investor from Long Island, N.Y., Frank A Jurs II is a part-time author and avid student of macro-economics. You can find him on Twitter as @OccupyWisdom.
(Nothing whatsoever in the above article should be construed, interpreted, or used as investment advice. The above content is the opinion of the author and is not meant in any way to advise anyone on investment decisions, or be interpreted as advice on any strategy, investment product or plan).
|